FarmChamps TECdi is a platform for farmers and farm consultants, where they can monitor their farm performance metrics and receive alerts, when the farm data exceeds certain quality parameters. The dashboards with KPIs are highly customizable, allowing the farmer to define particular animal groups and metrics to be monitored. The platform integrates other services, like feed calculator, weather forecast, indoor climate etc.
Background
The idea behind this product is that the farmers often wait for several weeks until they discover some issues in their farm business. It is so until a farm consultant analyzes the Excel sheets with raw farm data and figures out the factors impacting the farm performance. Delayed status info thus reduces business profitability. The case can be even more difficult when farm consultancy is done rarely.
The goal of FarmChamps was to create a digital solution, which wouls help keep track of all vital farm KPIs and receive insights and recommendations on farm-related issues. The KPIs would be updated daily, helping farm managers be always in the know of their business status.
Challenge
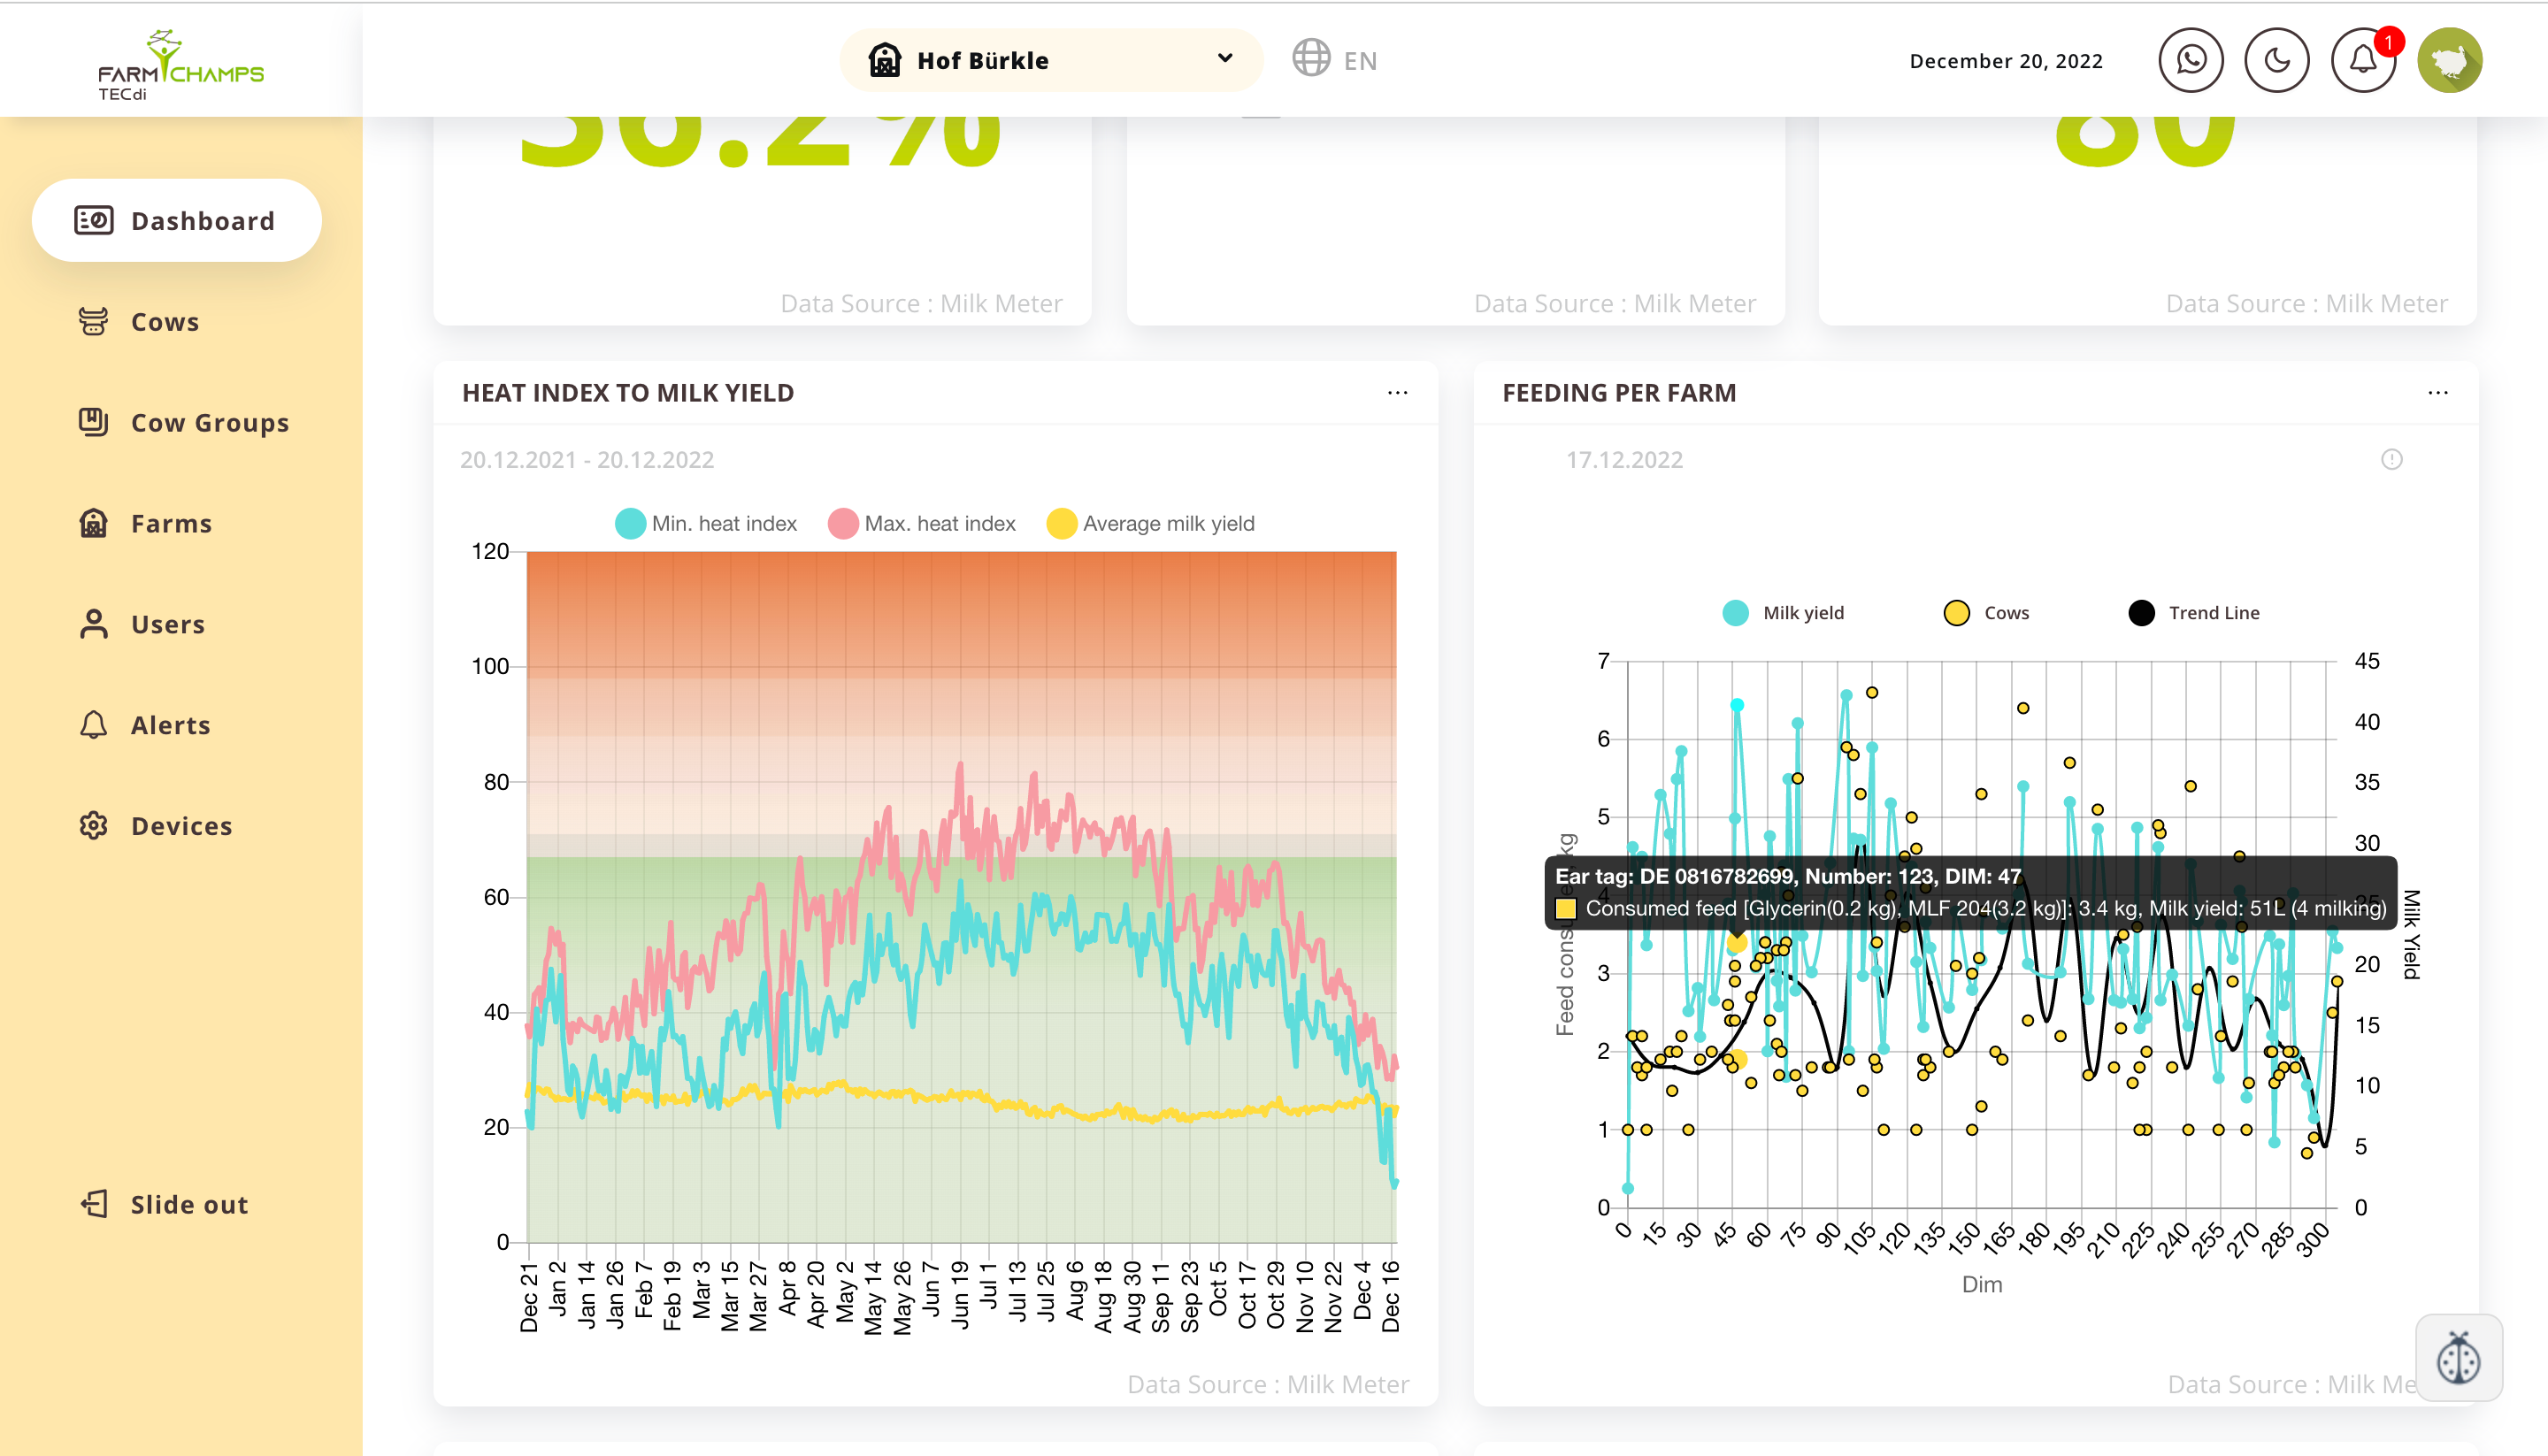
The main challenge of this solution was to transform the existing load of farm data into actionable metrics. The FarmChamps TECdi receives farm data from milking robots, feed mixers and activity sensors via a data warehouse. The calculations of such metrics are run on the middleware, and then displayed on the user dashboard.
The dashboard needs to be customizable per needs of a specific farm, allowing users to set up targets, preferred view of KPIs (chart, value, gauge etc.), size and order of the tiles, etc. The app is also designed to be mobile responsive, as farmers often times need to check KPIs on the go.
Solution
Our team has successfully delivered the digital product, and continues to further improve and maintain it.
The FarmChamps TecDI solution has such features as:
- Data Factory – a middleware, where farm data is synchronized and prepared for display on the dashboard
- Dynamic dashboard, tiles can be easily rearranged and resized
- Different tiles types: value, donut chart, bar chart, line chart, gauge
- Tiles configurability: target, view, size, period
- Drill-down capability of all tiles
- Light/dark view mode
- Alerts/Notifications center
- Mobile view responsiveness
Demo Video
Tech Stack
React, Redux, Saga, Node, Sequelize, MSSQL, Azure, Rolebar, Python, JupyterLab
Services
- Business Analysis
- Project Management
- UI/UX Design
- Frontend Development
- Backend Development
- Data Engineering
- Automation Testing
Testimonial
Peter Brylski, CEO FarmChamps GmbH & Co. KG
“Bitcom has been steadily demonstrating high level of dedication and performance. We’ve built together several digital solutions. They’re our reliable partner”.